


Democrats vs. Republicans: Who Are Worse Drivers?

The 2016 presidential election is right around the corner, and what better way to join all the hype and political build up than by comparing the two parties’ driving history? Okay, I realize driving history may not as be as interesting as the endless memes made for Donald Trump’s hair or Hillary’s unorthodox campaign logo. Nevertheless, the information below provides arguable contrast that might make someone believe one party is worse at driving than the other.
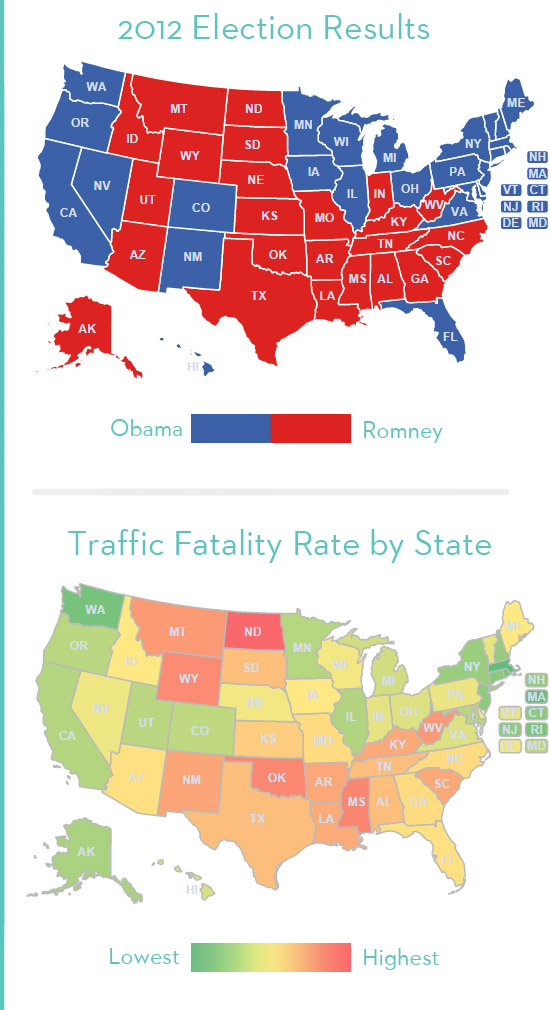
I came across a 2013 nationwide report analyzing the fatality rate in car accidents. The data focuses on the number of motor vehicle deaths per 100,000 people. Thanks to one of our Obrella insurance analysts, an interesting correlation was made between the states with higher than average traffic fatality rates and the fact that those states were also supporters of Mitt Romney in 2012. That led me to question whether republicans are worse drivers than democrats.
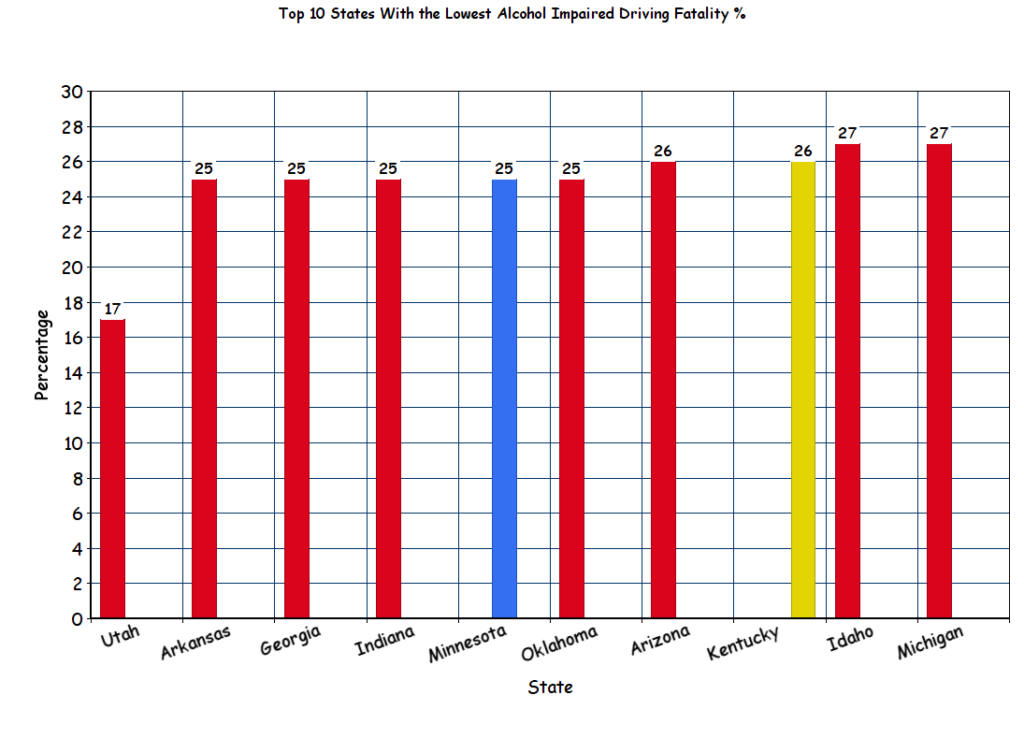
One aspect in particular that stuck out to me, aside from the traffic fatality rate by state, was the fatality percentage of drivers under the influence of alcohol. If you take a look at the top 10 states with the lowest percentage of impaired driving fatalities, you’ll find that 8 out of those 10 states are republican. The problem here is that one of those states is split (Kentucky), so only one state is represented by the democrat party. That means there isn’t equal data to compare the two.
With this contrast highlighted, does this now mean that the republicans are safer drivers? Do democrats overdo it when it comes to enjoying a beverage or three? I would say, who knows? The one thing I did figure out while delving into this research is that inconsistencies can be found when comparing these two political parties when it comes to safe driving.
There were some bumps along the way in my quest to figure this out. Looking at the data, states that voted Trump topped the charts for the most vehicular fatalities. However, traffic safety is hard to break down state-by-state. Multiple facets play into the calculation of these statistics—weather inconsistencies, average miles traveled, road conditions, “drive through” traffic, public transportation, etc. So honestly, it’s hard to say that the correlation between republicans and bad driving is true—especially if you dive into other influential aspects of the report.
Everything you read online is not always true—I hope we have all learned that by now. Assumptions, even backed by specific statistics, can appear to be iron-clad, but are no more than an opinionated analysis. So while I can’t debunk or prove this question, I can tell you that the next time you dive into a comparative report, remember the differences between correlation and causation to help improve your understanding of data analysis. Afterall, you wouldn’t want to go believing something that isn’t true, would you?
*Methodology: Rankings were determined by the analysis of data from the National Highway Traffic Safety Administration’s National Center for Statistics and Analysis. Additional state-level data is available at NCSA’s website.
Free Insurance Comparison
Enter your zip code below to view companies that have cheap insurance rates.